The Mississippi is moving different freight than it was two years ago. Here is what changed, what it means for operators and shippers, and where the market is heading.
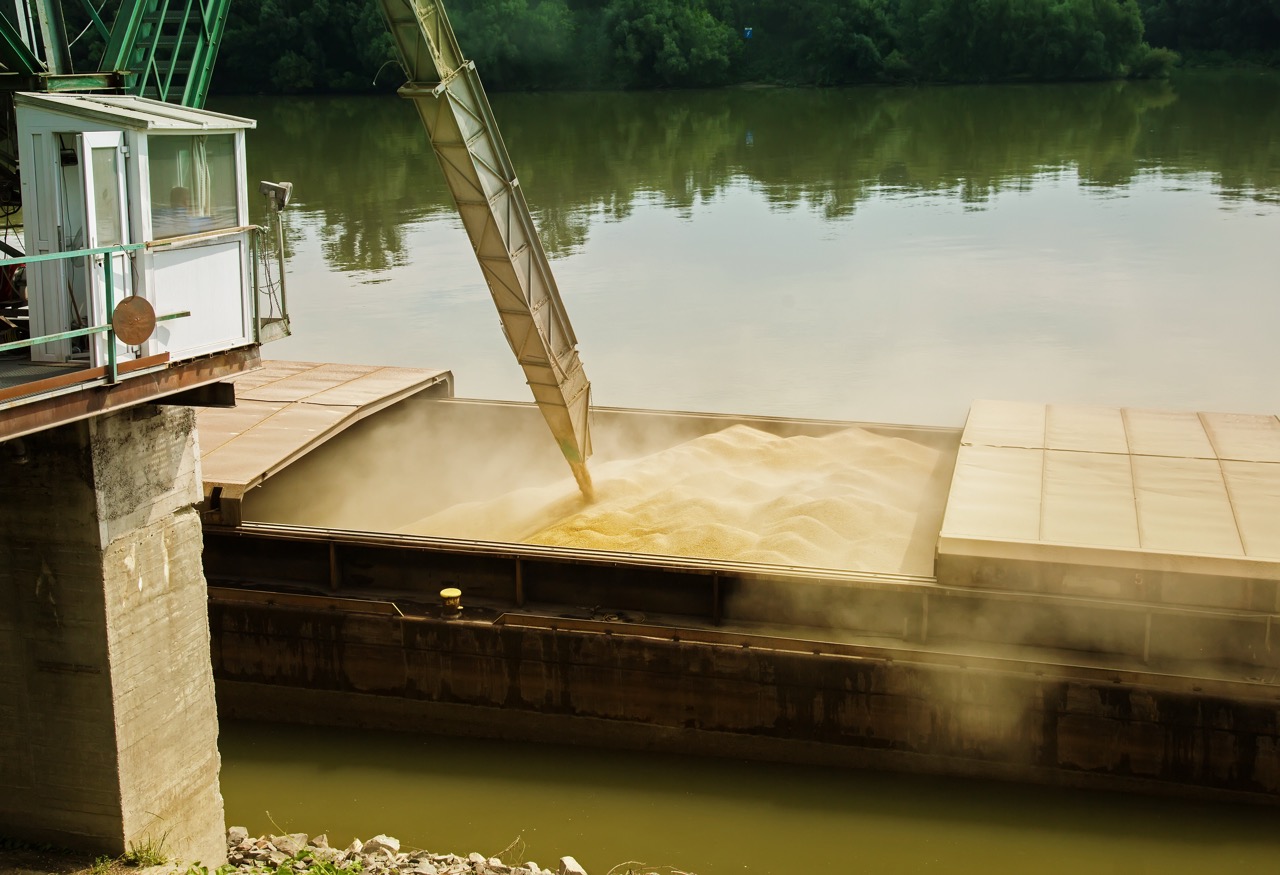
Walk down to the river at any major grain elevator along the Lower Mississippi today and you will see something that tells the whole story at a glance. The covered barge tows are moving, but the mix of what is inside them has shifted in ways that carry real consequences for every operator, shipper, and terminal manager on the inland waterway system.
The forces behind that shift are not subtle. A prolonged trade standoff between the US and China gutted American soybean exports through most of 2025. A record-breaking corn harvest is now pushing record export volumes through the same Gulf corridor. Coal continues its decade-long decline as a cargo category. And Brazil has locked in a structural advantage in the global soybean market that is not going away when the next diplomatic handshake is announced.
For barge operators and shippers, understanding these forces is not a matter of following commodity markets for their own sake. It is about knowing what kind of freight will be competing for capacity, when demand will spike, what rates will do, and where the long-term opportunities are on the river.
The Soybean Reckoning
For decades, soybeans were among the most reliable and high-volume commodities on the inland waterway system. Nearly half of all US corn, soybean, and wheat exports move through the Mississippi River system, and for soybeans in particular, the route from Midwest farms to Gulf export terminals is almost entirely dependent on barge transportation. That pipeline took a serious hit in 2025.
China, which historically accounted for more than half of all US soybean exports, largely stopped buying from American suppliers through the middle of 2025. The cause was a combination of retaliatory tariffs tied to the broader US-China trade dispute, and a simple competitive reality: US soybeans entering China face a 13% total tariff while Brazilian beans carry only a 3% duty. That 10-percentage-point gap makes Brazilian soybeans cheaper for Chinese crushers regardless of what diplomats are saying.
Brazil moved aggressively to fill the void. Brazil shipped a record 86 million metric tons of soybeans to China in 2025, and the leaders of Brazil's top soybean-growing state have already signaled they expect to match or exceed that figure in 2026. In the first half of 2025, Brazil accounted for roughly 65% of China's soybean imports, a share that reflects not just tariff dynamics but years of Chinese investment in South American port infrastructure.
The effects on US export infrastructure were visible in port data. At the New Orleans district, a dominant grain corridor, soybean exports grew less than 3% between September 2024 and September 2025. Shipments through the Seattle district fell 81%, according to the Bureau of Transportation Statistics.
A November 2025 trade agreement brought some relief, with China committing to purchase at least 25 million metric tons of US soybeans annually through 2028. But most analysts do not expect that commitment to fully hold in the near term. Most market participants forecast actual US soybean exports to China at only 8 to 9 million MT for the current marketing year, compared to 22.6 million MT in 2024-25. The market is recovering, not recovered.
Brazil has become a more reliable source for soybeans than the US. I don't believe exports to China will go to zero, but it's going to be something less than what it was prior to 2025. -- Michael Langemeier, Purdue University
For barge operators, the practical consequence of the soybean situation is not just a near-term volume shortfall. It is a shift in what the covered barge market looks like going forward. During the 2022-23 soybean slump, the covered barge market faced a cargo shortfall equivalent to more than 1,000 excess barges, according to reporting from The Waterways Journal. Shippers and operators who relied on consistent soybean volume to anchor their freight planning need to adjust that assumption.
Corn Steps Into the Gap
If soybeans are the story of what has gone wrong for US agricultural exports, corn is the story of what has gone right, and the numbers are genuinely historic.
The 2025-26 US corn crop came in at more than 16.7 billion bushels, a new record, driven by a yield of 188.8 bushels per acre across a harvested area that expanded by nearly 2 million acres. USDA's World Agriculture Supply and Demand Estimates now forecast US corn exports at 2,875 million bushels for 2025-26, which would be the highest export volume in US history.
The buyers driving that volume are not the same single buyer that dominated the soybean trade. Mexico has solidified its position as the leading destination for US corn, with massive commitments from the Mexican livestock and poultry sectors. Japan and several Southeast Asian markets have also stepped up buying. That diversification away from China dependency is one of the more constructive developments in US agricultural trade right now, and it has direct implications for the barge market.
Because more than 95% of grain and soybeans exported through the Center Gulf terminals on the Mississippi River Ship Channel arrives by barge, a record corn export year means real demand for covered barge capacity in the grain corridor. It also means shippers need to think carefully about seasonal timing. Corn's harvest and export windows differ from soybeans in ways that affect when demand spikes occur and when rates are most likely to tighten.
The net picture on agricultural exports is one of recovery, not collapse. Total US grain and soybean exports for 2024-25 are forecast at nearly 147.6 million metric tons, about 15% higher than 2023-24 and about 23% above the recent low in 2022-23. But the commodity mix on the river has changed, and operators who plan around it as if soybeans and corn are interchangeable are going to be caught off-guard.
Coal's Long Decline
While the agricultural story gets most of the attention, the single biggest driver pushing total barge volumes lower over the past decade has been coal. And that decline is not reversing.
US coal production ended 2024 at 512.1 million short tons, down 11% from 2023. Coal exports, which may have peaked at 107.6 million short tons in 2024, are forecast to fall nearly 13% in 2025. For nine consecutive years through 2023, total barge commodity volumes on inland waterways declined year over year, and coal is the primary reason. On the Illinois Waterway, cargo volumes have dropped nearly 36% since the 2017 peak, according to US Army Corps of Engineers data.
Petroleum and petroleum products are partially filling that gap. US consumption of refined petroleum products has recovered to near pre-COVID levels, providing a more stable base for tank barge operators. Agricultural chemicals and fertilizers, which move upstream to support crop production, continue to flow. And as US soybean crush capacity expands, driven by demand for soybean oil as a feedstock in renewable diesel production, more soybean meal and oil is moving on the river even as whole-bean export volumes to China have declined.
The fleet is aging alongside these commodity shifts. Nearly 40% of the 2024 barge fleet was 20 years old or older. Retirement and replacement decisions are being made against a backdrop of genuine uncertainty about which commodities will dominate the river in five years.
What Operators and Shippers Should Be Doing Now
The macro picture translates to a set of practical questions for anyone moving cargo on the inland waterway system.
Revisit your capacity assumptions. The seasonal pattern of barge demand is shifting as corn replaces soybeans as the dominant agricultural export commodity in the Center Gulf corridor. If your freight planning was built around historical soybean export windows, it needs to be updated.
Build in geopolitical risk. The 2018 and 2025 trade disputes both demonstrate that US-China agricultural trade can move from 22-plus million metric tons to near-zero in a matter of months. Shippers who depend heavily on export-bound grain freight should be stress-testing their operations against another interruption, not assuming the November trade deal holds at the volumes promised.
Pay attention to acreage signals. With soybean profitability under pressure and corn having a strong year, USDA's preliminary 2026 projections point to more corn acres and fewer soybean acres. That trend, if it holds, will further shape what moves on the river for the next two to three years.
Watch the infrastructure investments. The Water Resources Development Act of 2024 changed the federal cost-share formula for locks and dams projects to 75/25, a long-held industry goal that effectively channels more federal money into waterway maintenance and improvements. A $38 million Port Infrastructure Development Program grant was recently awarded to a new barge terminal in Hennepin, Illinois. These are signals of long-term commitment to the inland waterway system as a freight mode, even as the commodity mix continues to evolve.
Data and visibility are now competitive advantages. When cargo flows shift as quickly as they have over the past two years, the operators and shippers who can see barge availability, rate movement, and freight flow data in real time are in a materially better position than those relying on last quarter's assumptions.
The inland waterway system is not in decline. It is in transition. Record corn exports are moving through the same Mississippi corridor that handled record soybean volumes in years past. Infrastructure investment is accelerating. Tank barge demand is stabilizing. The operators and shippers who understand what changed, and why, are the ones who will navigate the next few years with the least disruption and the most opportunity.
The river is still working. The question is whether your strategy is keeping up with it.
See how BargeOS gives you real-time visibility into capacity and rates so when the market shifts, you are already moving. Schedule a demo today.

.png)